


Chart of the Day (CotD) The Final Countdown
May 26, 2025

eldric.substack.com
This CotD is the 4th Annual update of the “The Final Countdown” special edition. The following presentation is the result of a multi-decadal journey through the fog of many narratives related to economics and finances. Fortunately, all of the data is available and thus is able to guide us to some degree through our life journey. As an engineer, the author must always verify things that are presented to the public in a factual and truthful manner. My wife always says “you over analyze, just make a decision” or something to that effect. She is also very supportive of what I do and does say once in a while “you do know a lot of stuff”. So let’s go through some of my stuff and view some interesting things a little more clearly through the fog.
This CotD was named “The Final Countdown” which was inspired by 220 Musicos Tocando (www.youtube.com/watch?v=16DNjGBMy5I) .
And in challenging times, a call from the Maori people of New Zealand (www.youtube.com/watch?v=FLNe4agf1ME).
Panel 1 The first graph is the historical presentation of the Dow Jones Industrial Average Index (DJIA) since 1900. Upper and lower limit lines define the DJIA channel trend (author’s interpretation). There are some significant observations that may or may not be obvious:
- The Great Crash of September 1929 to February 1933 resulted in stock market losses of 86 percent. The DJIA recovered to pre-crash levels some 22 years later in 1955.
- The Silent Crash (author’s concept) occurred from 1966 to 1982 as the DJIA floundered sideways for 16 years essentially wiping-out over 70 percent (the author’s estimate) of market value due to inflation.
- The period from 1982 to 2000 was the greatest bull market run in history as the DJIA increased 10 fold in 18 years or about 14 percent per year.
- The first decade of the 2000s brought two short crashes – 2003 resulted in a 36 percent loss and in 2009 a 53 percent loss.
- Since the 2009 low of 6,627, the DJIA has recovered to reach an all-time closing high at 45,014 on December 4, 2024 (a 13 percent per year return).
In the author’s opinion, there are essentially two paths for the DJIA to follow as depicted on the chart. A severe market crash similar to the 1929 Great Crash is possible as the DJIA falls to the 5,000 level by about 2028-29 (a loss of 89 percent). The alternate path is a volatile sideways market similar to the period of 1966 to 1982 as this reflects the inflationary period we are now experiencing which would result in similar real losses or maybe worse. The author has dubbed these new depression scenarios as “The Great Redux” and “The Great Waffle”, respectively. Likely the answer could be somewhere in between these two scenarios…these are fascinating times and the pathway ahead is still unclear.

Panel 2 This graph presents the historical gold price since 1900 with upper and lower limit lines defining the channel trend (author’s interpretation). The green line is the author’s forecast based on ~47 year cycle peaks which predicts a gold price in the order of 20,000 $US/oz by about 2028 or 2029. The gold price will increase multi-fold ($5,000 $US/oz per year) over the next few years regardless of the DJIA market path. Inflation is the key.

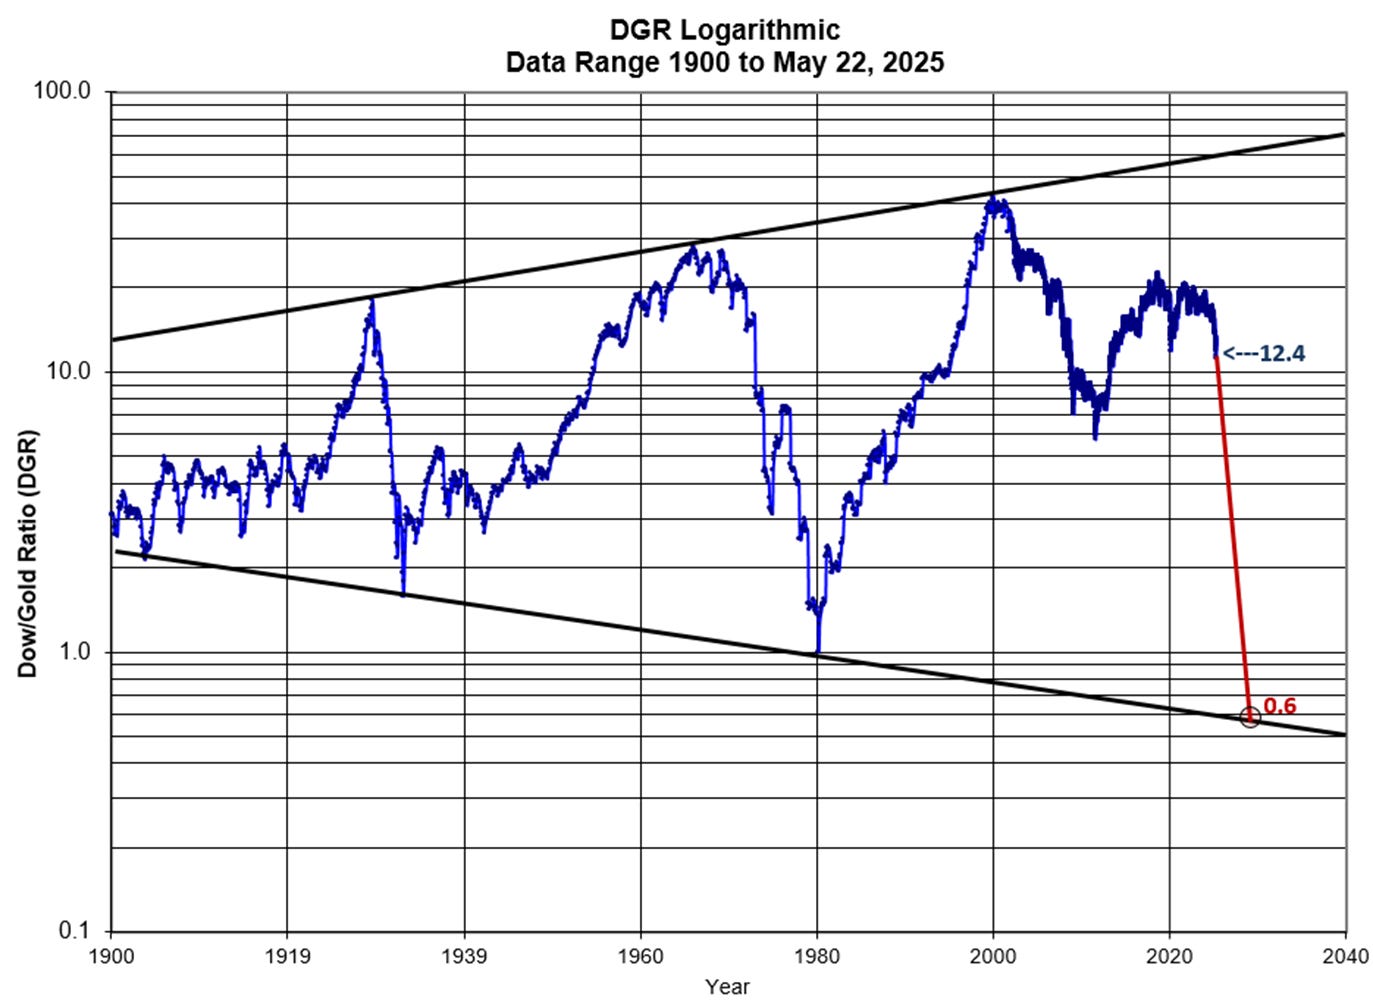
Panel 3 The Dow-Gold Ratio (DGR) is a simple ratio of the Dow Jones Industrial Average Index divided by the gold price in $US. The ratio depicts the battle between the main USA stock index DJIA (in fiat dollars) versus real tangible value in gold (historically real money). This graph presents the historical DGR since 1900 with upper and lower limit lines defining the channel trend. The DGR is predicted (author’s forecast) to achieve 1 or less by about 2028 to 2029 as shown with the red line. As an example forecast, the DJIA would fall to 12,000 with gold at 20,000 $US/oz to achieve a 0.6 DGR.
Panel 4 This graph is the historical DGR Normalized to the highs and lows. In mathematical terms, this DGR Normalized plot is a derivative of Chart 3 above. (Once again, the semi-log plot is a fave of the CotD author).

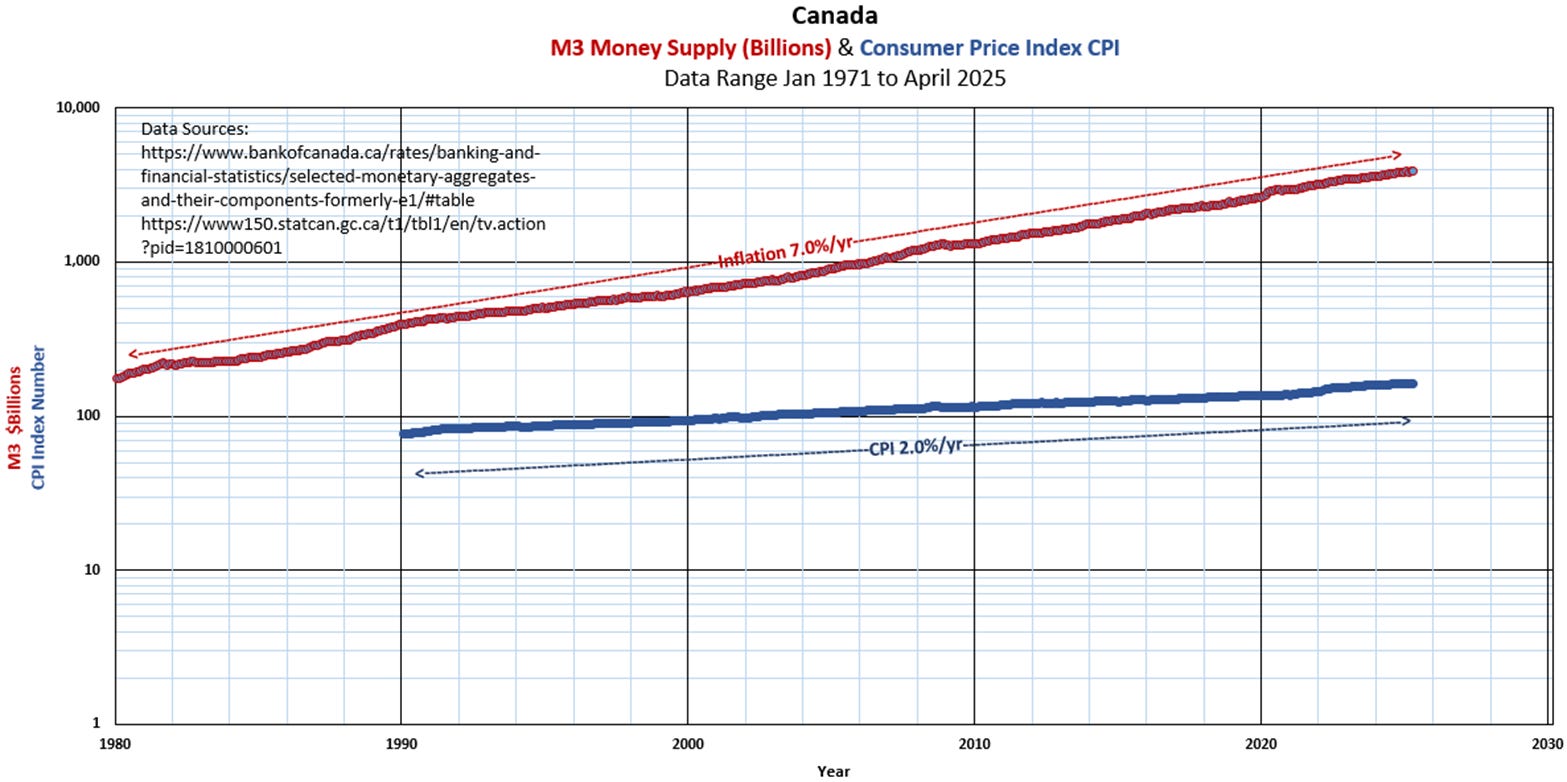
Panel 5 Canada’s M3 Money Supply and Consumer Price Index (CPI) based on data from the Bank of Canada and Statistics Canada to April 2025.
Panel 6 Some of the author’s comments:

True wealth is not measured in money or status or power. It is measured in the legacy we leave behind for those we love and those we inspire” Cesar Chavez
