eldric.substack.com
This CotD was inspired by recent water bills on an island in the Pacific, namely, Vancouver Island. In general, water consumption charges have been relatively reasonable with cost increases close to the consumer price index (CPI). However, this year, water billing charges caught most people by surprise. This demanded investigation into what really happened….so let’s look at what occurred.
Panel 1
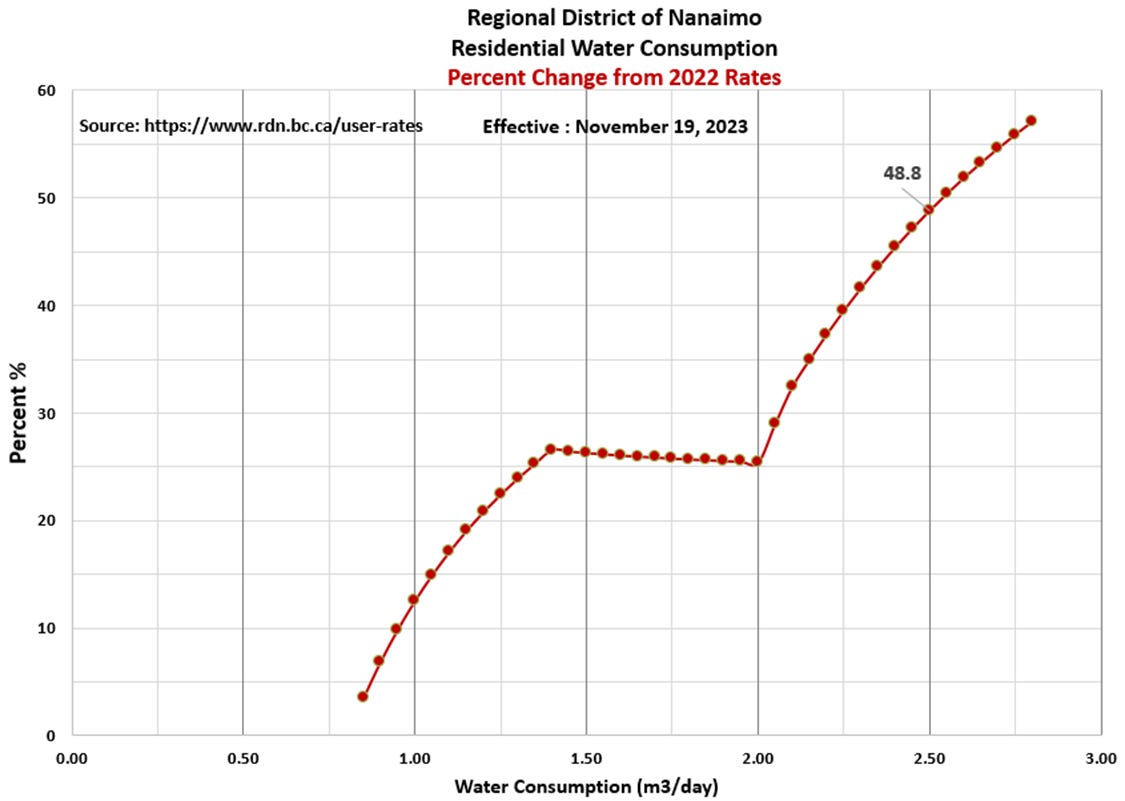
The area of investigation is within the Regional District of Nanaimo (RDN) British Columbia and includes the following nine service areas: Surfside, French Creek, Whiskey Creek, Decourcey, San Pareil, Englishman River, Melrose Terrace, Nanoose Peninsula and Westurne Heights. The following table presents the RDN water consumption calculation for the years 2022 and 2023. Note the changes to the Daily Rates and Daily Costs $/m3 which have contributed to the overall increases. The example of a residence/business utilizing water at an average of 2.5 m3/day results in a 48.8 percent increase (well beyond inflation).
Panel 2
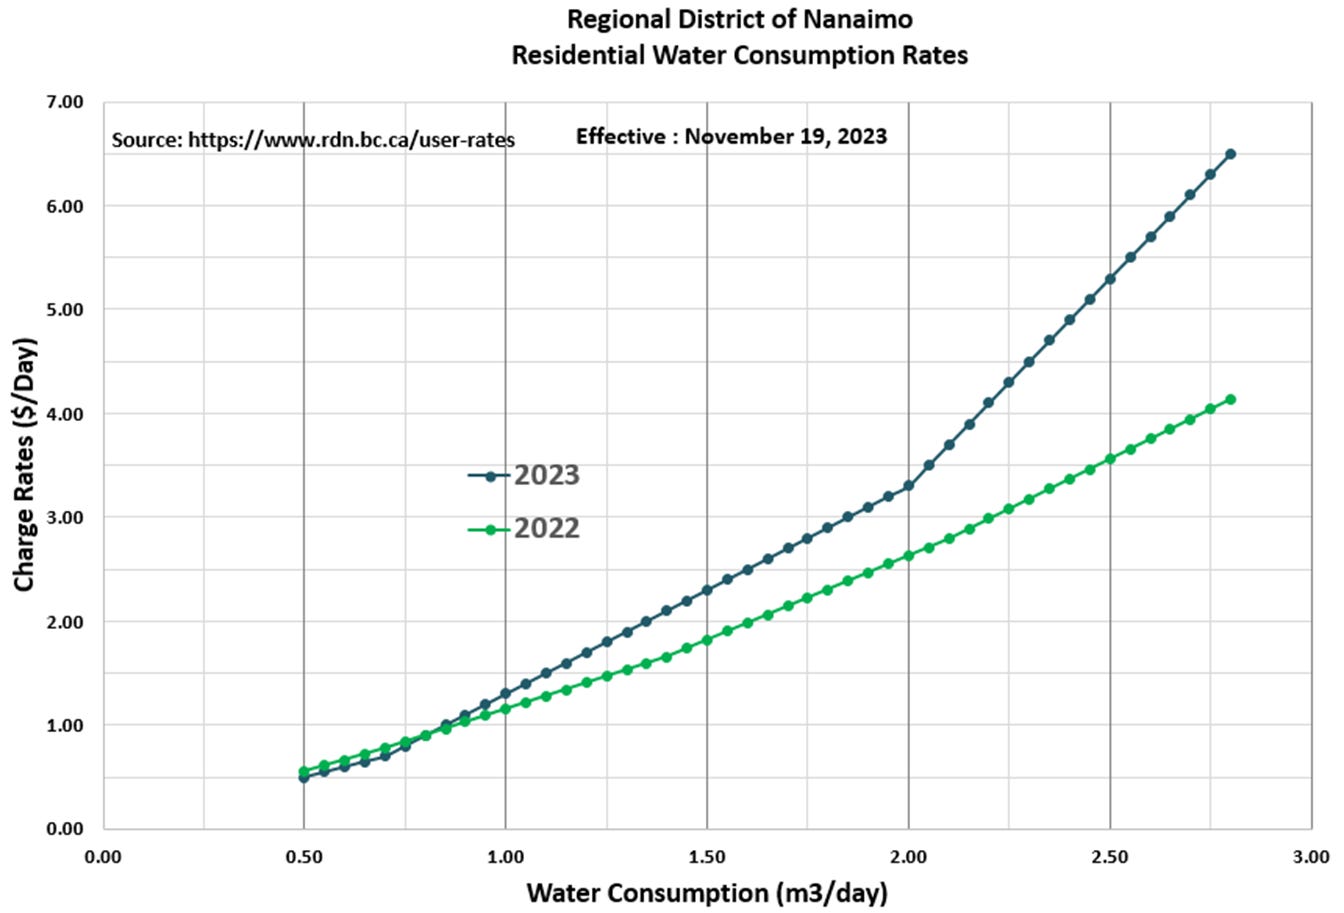
This is a graphical representation of the Water Consumption Rates for the years 2022 and 2023 based on the tables in Panel 1.
Panel 3
This graph presents the Percent Change from 2022 to 2023 in Water Consumption Rates. Initially, one may think this is an odd looking graph, and you would be correct. The changes are directly related to the Daily Rate period and charge rates per period. During the “low consumption period” of October to April, the nine service areas consumption is in the order of 0.5 m3/day per area, so the water billing charges should not change, and actually may decrease slightly. During the “high consumption period” of May to September, the consumption increases to 1.2 m3/day per service area, resulting in an average billing increase of close to 20 percent. One could experience billing increases of 25 to 50 percent, depending on gardening/agriculture needs during the dry season.
“Water is the driving force in nature” Leonardo da Vinci


