eldric.substack.com
This CotD is a continuation of some of the author’s basic knowledge of economics related to Canada, in this case from a macroeconomic point of view. In this regard, a look at Canada’s money supply, gross domestic product (GDP), velocity of money and Bank of Canada interest rates are necessary in order to gain some understanding of potentially where Canada’s economy may be heading.
Panel 1
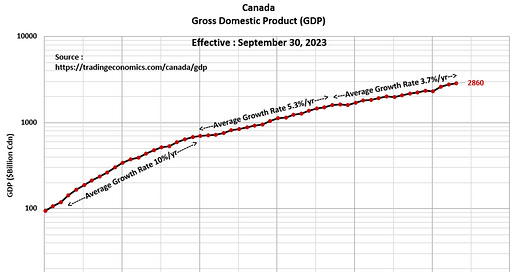
This is the graphical presentation of Canada’s gross domestic product (GDP) since 1970. GDP is a monetary measure of the market value of all of the final goods and services produced in a specific time (in this case on an annual basis). GDP is considered a reliable indicator of a country’s economic health.
Canada’s GDP was “running on all 8-cylinders” from 1970 to 1990 with average GDP growth rates of 10 percent year. The period from 1991 to 2007 reveals a significant (47 percent) negative change in the GDP growth rate to 5.3 percent per year. Since 2008, the growth rate in GDP has averaged 3.7 percent per year which is 30 percent less than the previous period. Canada’s GDP “growth rate” has declined a whopping 63 percent since 1990.
Panel 2
This is Canada’s year-on-year growth ($Billion) in GDP.
Panel 3
This graph presents the annual “growth rate” in GDP. Note the steady decline in growth rate since the 1970’s. The question is “why is this occurring?”.
Panel 4
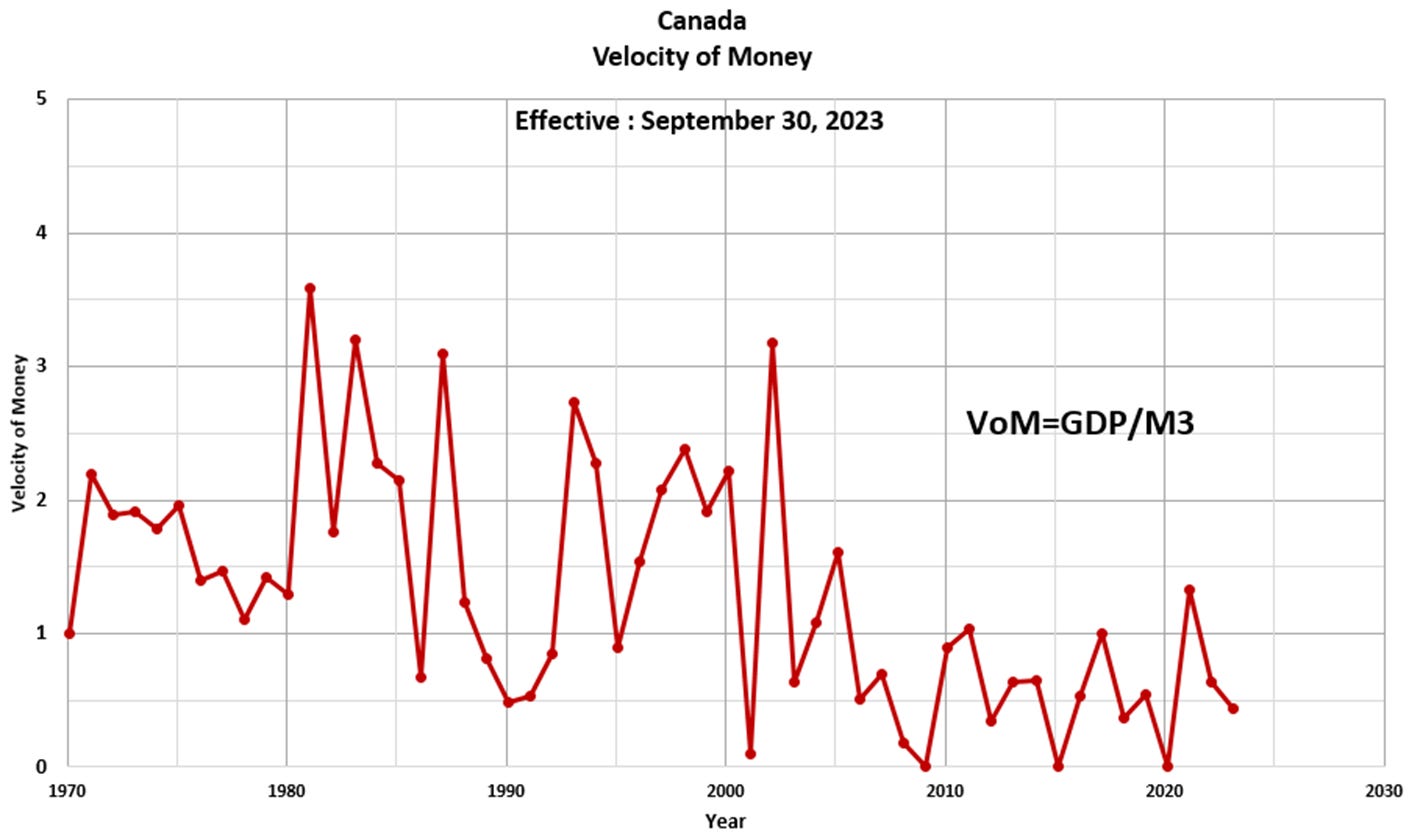
The Velocity of Money (VoM) is the number of times that a unit of currency is spent to buy goods and services in a period of time. The VoM is an indicator on the health and vitality of an economy. High money velocity is usually associated with a healthy, expanding economy. Low money velocity is usually associated with recessions and contractions. Once again, observe the steady decline in VoM over the past 50 years. Since 2008, the VoM has averaged in the order of 0.5 which is very low in the authors’ opinion.
Panel 5
The Bank of Canada (BoC) lending rate or bank rate declined significantly since the 1980’s. The lowering of interest rates over time should have had a positive effect on the GDP and VoM, however, this does not appear to be the case. The trends in GDP and VoM mirror the trend in the Bank of Canada Bank Rates which would seem antithetical to the physics of economics. The question “is the current BoC rate of 5.25 percent sustainable considering that relative household debts are at the highest levels in history?”.
Panel 6
The source of inflation is from a country’s central bank, in this case, the Bank of Canada (BoC) and M3 Money Supply. The “Selected Monetary Aggregates and their Components” can be accessed via the BoC website: https://www.bankofcanada.ca/rates/banking-and-financial-statistics/selected-monetary-aggregates-and-their-components-formerly-e1/#table. Monetary Inflation via the BoC has averaged 7.3 percent per year since the 1980’s. The published Consumer Price Index CPI (see: https://www150.statcan.gc.ca/t1/tbl1/en/tv.action?pid=1810000601) does not fully reflect true living expenses and by default is too low of an indicator. The CPI has increased substantially and has averaged in the order of 5.5 percent per year since 2021.
“This is the time of the vulture, for the vulture feeds neither upon the pastures of the bull nor the stored up wealth of the bear. The vulture feeds instead upon the blind ignorance and denial of the ostrich. The time of the vulture is at hand”. Darryl Robert Schoon from his book “Time of the Vulture”


