


Chart of the Day (CotD) Canada Covid-19 Death Rates
April 25, 2023

This is a technical Chart of the Day related to Covid-19 cases and deaths in Canada. Since the beginning of the pandemic, the relationship between Covid-19 cases and related deaths is implicit and thus definitely of interest. It is therefore absolutely necessary to be able to visualize how the “rate of change” in the cumulative death rate changes with time relative to cumulative cases. The Red curve in this graph is the Cumulative Death Rate (CDR) and the Blue curve is the Relative Death Rate (RDR) which presents the “rate of change” to the CDR (i.e. the derivative of the CDR). In the author’s opinion, this graph presents one of the most important pieces of information regarding the Covid-19 story i.e. the Canada maximum RDR of 9.1 percent occurred in late June 2020 and has since declined to 1.1 percent (a collapse of 88 percent). It appears the curve has been “flattened” and the pandemic is long over.
Panel 1

Observe the 67 percent decline in RDR from June 2020 to December 2020, prior to the roll-out of the vaccine. Since January 2021, 36,000 Canadian citizens have died a Covid-19 related death which represents 70 percent of the total to date. A Total of 98 million vaccine doses have been administered in Canada over the past 28 months of which 83.4 percent have received at least one dose as per https://health-infobase.canada.ca/covid-19/vaccination-coverage/.
Panel 2

Panel 3
This is from Health Canada Covid-19 Epidemiology update as per https://health-infobase.canada.ca/covid-19/cases-following-vaccination.html. Interesting to note that this reporting ceased as of September 25, 2022 (7 months ago) due to “We are in the process of improving this page. Regular data updates will resume in the coming weeks. Data extracted on October 14, 2022 for cases between December 14, 2020 and September 25, 2022.”
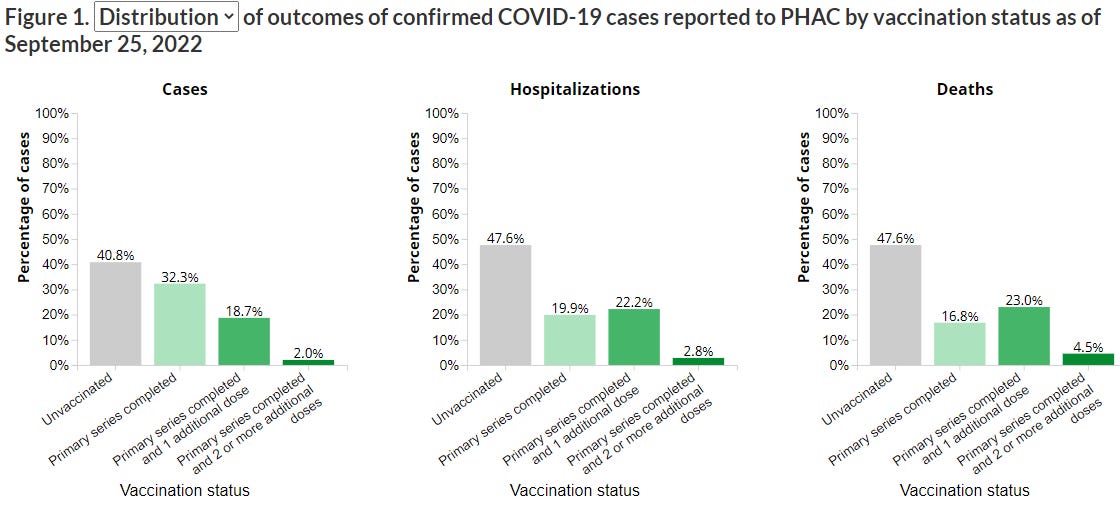
Panel 4
Note the “vaccinated” accounted for the majority of cumulative Cases, Hospitalizations and Deaths up to September 25, 2022. Reviewing the individual Reports revealed that the “vaccinated” portions increased dramatically since the fall of 2021 (i.e. over 80 percent) as from the October 29, 2022 CotD archives :
Chart of the Day (CotD) October 29, 2022
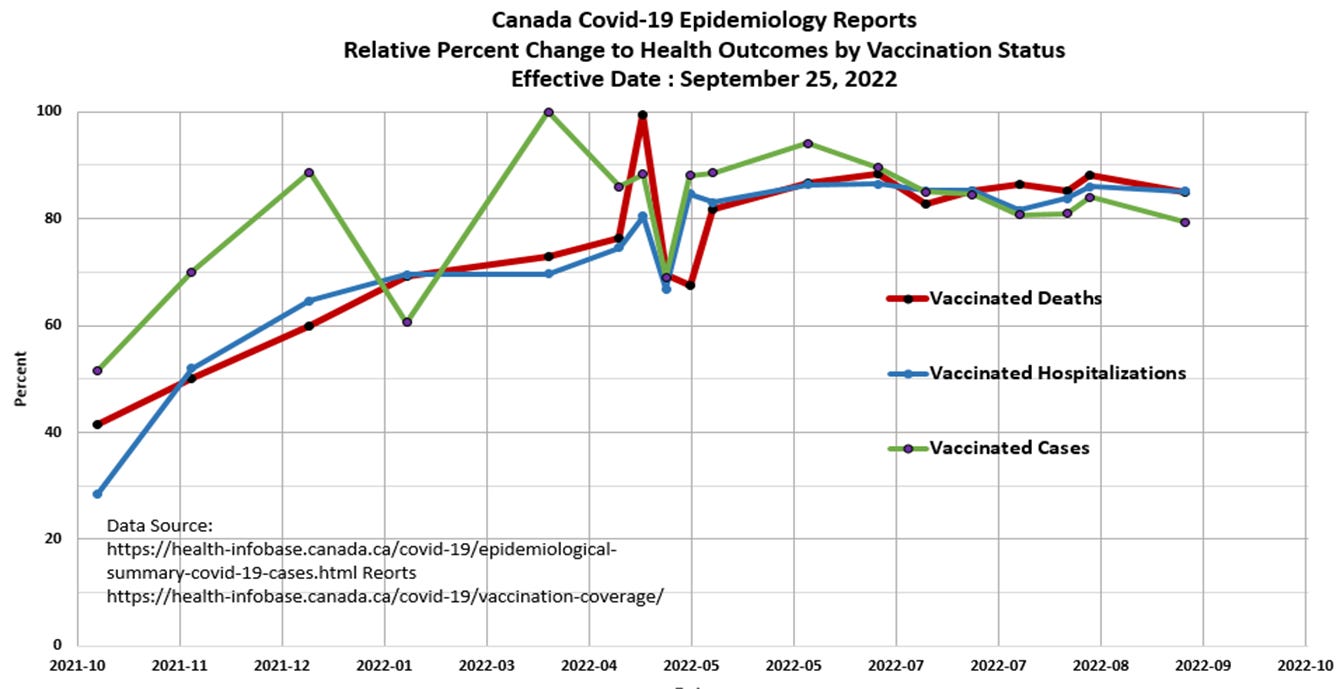
These are Health Canada data trends for the Vaccinated only via the Covid-19 Epidemiology Update reports. Click on the website source : https://health-infobase.canada.ca/covid-19/and then scroll down the page to Figure 5 for the most recent data. Previous reports are accessed in the Archive section. The data within Figure 5 are cumulative numbers as per Health Canada “since the start of the vaccine campaign” in December 2020. This particular graphical presentation depicts the “relative change to health outcomes” for the Vaccinated only since November 2021. Note the change in Covid Related Deaths for the Vaccinated only from about 40 percent to 85 percent of the totals over the past year.
1) Vaccinated persons account for 85.0 percent of Covid-19 deaths since June 2022
2) Remember, as per Health Canada : “Evidence indicates that vaccines and boosters are effective at helping to prevent serious illness, hospitalization and death due to COVID-19. Evidence indicates that the benefits of COVID-19 vaccines continue to outweigh the risks of the disease. Receiving an mRNA booster dose provides even better protection.”
3) Do you think the data supports these claims by Health Canada?
“All truth passes through three stages. First, it is ridiculed. Second, it is violently opposed. Third, it is accepted as being self-evident.” Arthur Schopenhauer